Technician Performance Audits
Full breakdowns of hours sold, flagged vs. clocked, efficiency, and productivity by tech — with clear hours lost/gained and revenue-impact figures.
FIXED OPS & PERFORMANCE ANALYTICS
We turn raw service-department data into technician performance scores, hours lost/gained reports, labor cost and expense breakdowns, and op-code intelligence — so you know exactly where the money's going before it's gone.
BUILT FROM THE SERVICE DRIVE — NOT A CONSULTING DECK
Independent — no parts, no DMS software, and no warranties to sell you.
WHAT WE DO
We plug into the data you already generate and surface the numbers your DMS report never shows you.
Full breakdowns of hours sold, flagged vs. clocked, efficiency, and productivity by tech — with clear hours lost/gained and revenue-impact figures.
De-duplicated, subtotal-free op code counts across every location — so you know exactly which operations drive your repair-order volume.
Net contribution per technician after wage cost — see who's actually driving fixed-ops profit and who's quietly costing you money.
Project Q1 performance forward into a defensible year-end forecast for staffing, revenue, and capacity planning.
Compare op-code mix, RO percentages, and efficiency across every rooftop in your group, side by side.
Board-ready Excel and dashboard deliverables — charts, pivot views, and exec summaries built around your KPIs.
HOW WE WORK
Send us your DMS exports — technician hours, RO detail, op codes, whatever you've got. We handle the messy Excel files.
We strip embedded subtotals, de-duplicate repair orders, and reconcile op codes so every number ties back to source data.
Efficiency, productivity, gain/loss, and cost-vs-revenue models get built per technician, per location, per op code.
You get a formatted, multi-sheet workbook with charts and an exec summary — ready for your next fixed-ops meeting.
WHY IT MATTERS
A service department can run at 100–120% efficiency on paper and still lose billable hours to comebacks, unapplied time, and work that never gets flagged. None of it appears on the summary screen.
Most departments sit below their labor gross profit target and cannot see, technician by technician, exactly where it is going.
Every repair order de-duplicated and reconciled to source before a single number is reported. No inflated counts, no black boxes.
Every technician score, op-code count and forecast ties back to the exact repair order it came from. You can audit any figure we give you.
OUR PRODUCTS
VINtage is our in-house vehicle profit tracker — built for classic and vintage dealers who need to know their real margin on every unit, not just their asking price.
DIGITAL DOWNLOADS
Standalone, self-contained tools for dealers who want the analytics without a full engagement — buy once, download instantly, no account required.
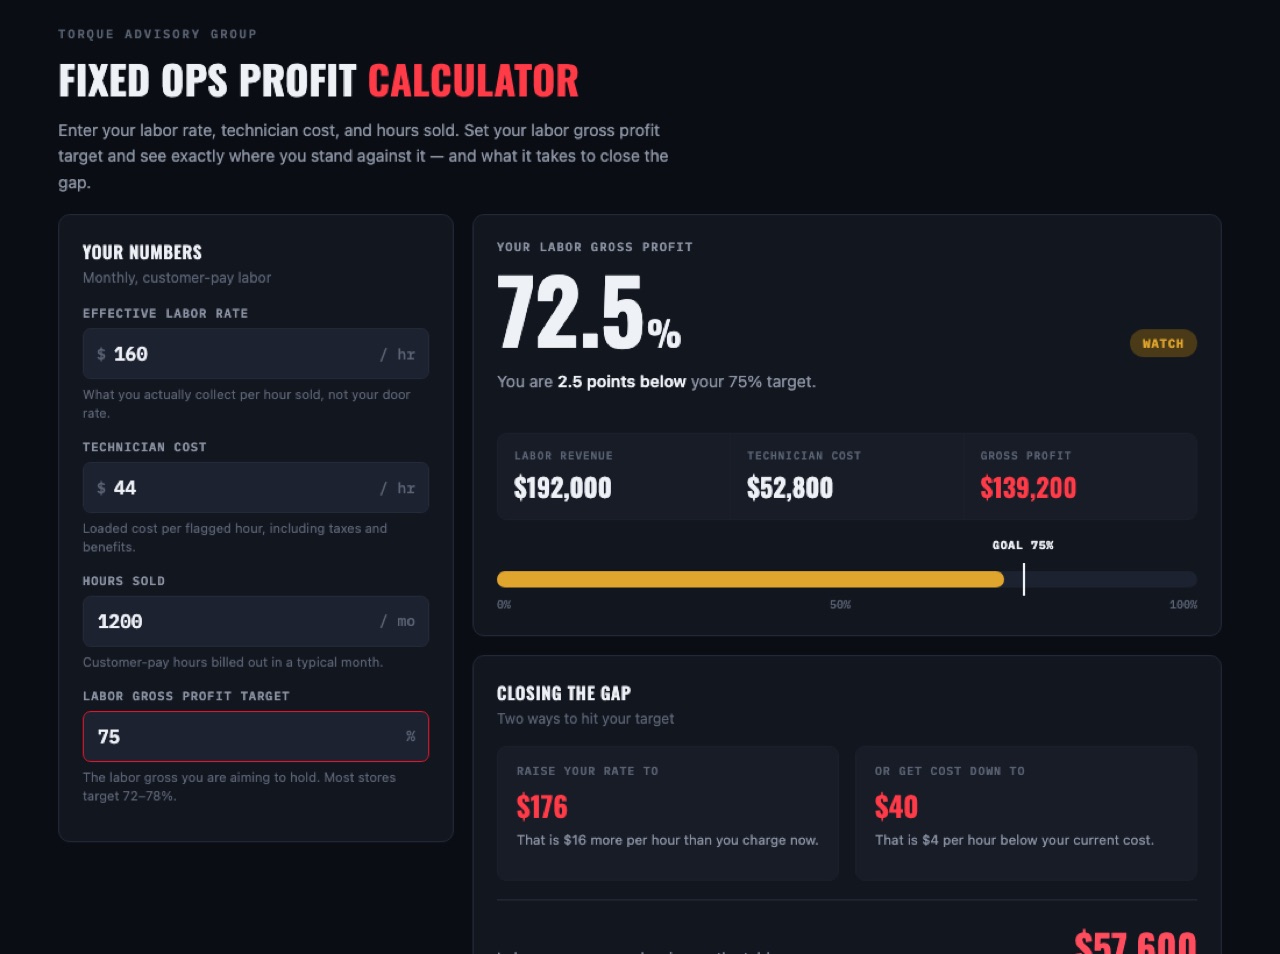
Set your labor gross profit target, enter three numbers, and see exactly where you stand against it — plus what it takes to close the gap and what the gap is costing you per year.
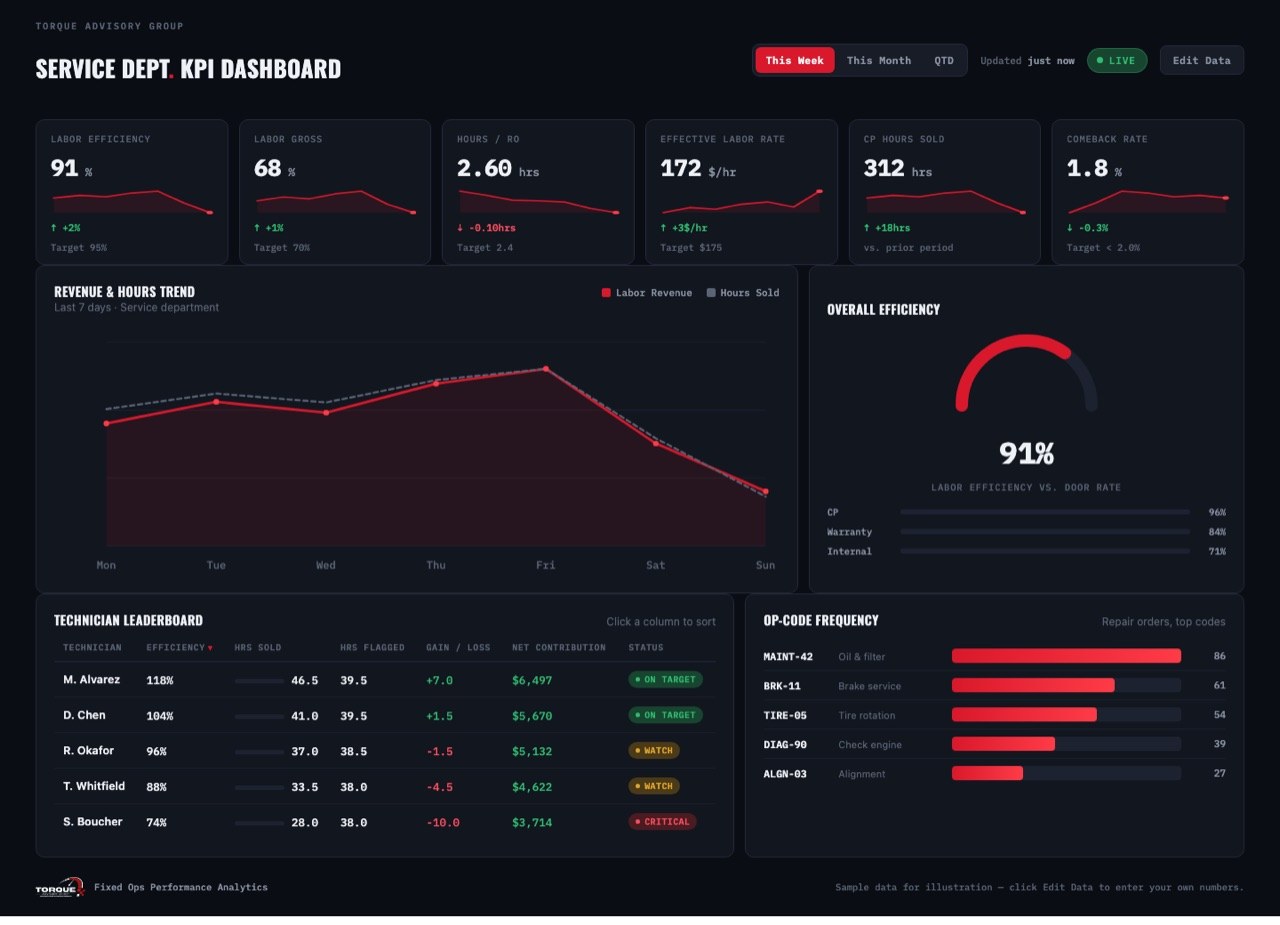
A Power BI-style performance tracker for your service department — labor efficiency, ELR, technician leaderboard, op-code frequency, and revenue trends in one screen.
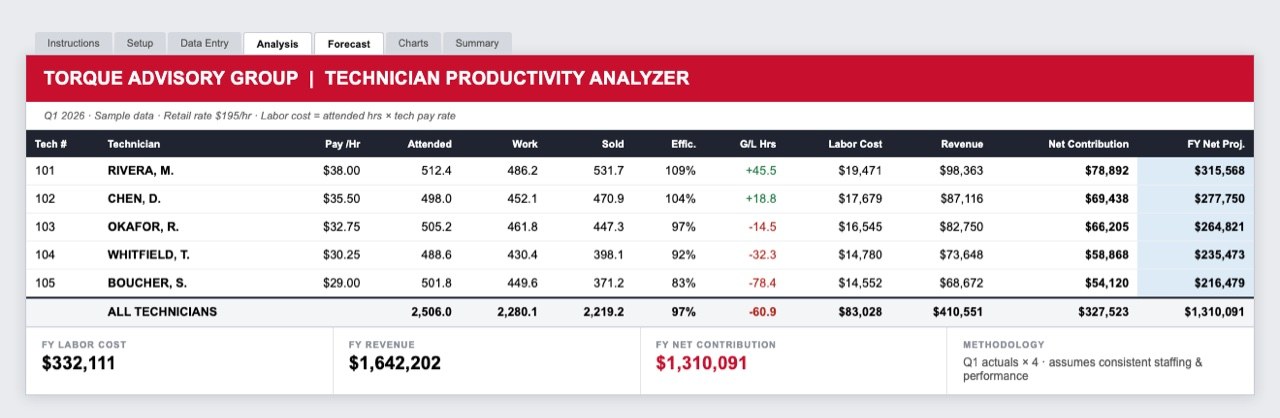
The tool that tells you where the year ends up — and while there's still time to change it. Enter a quarter, and it projects the full year by technician, by store.
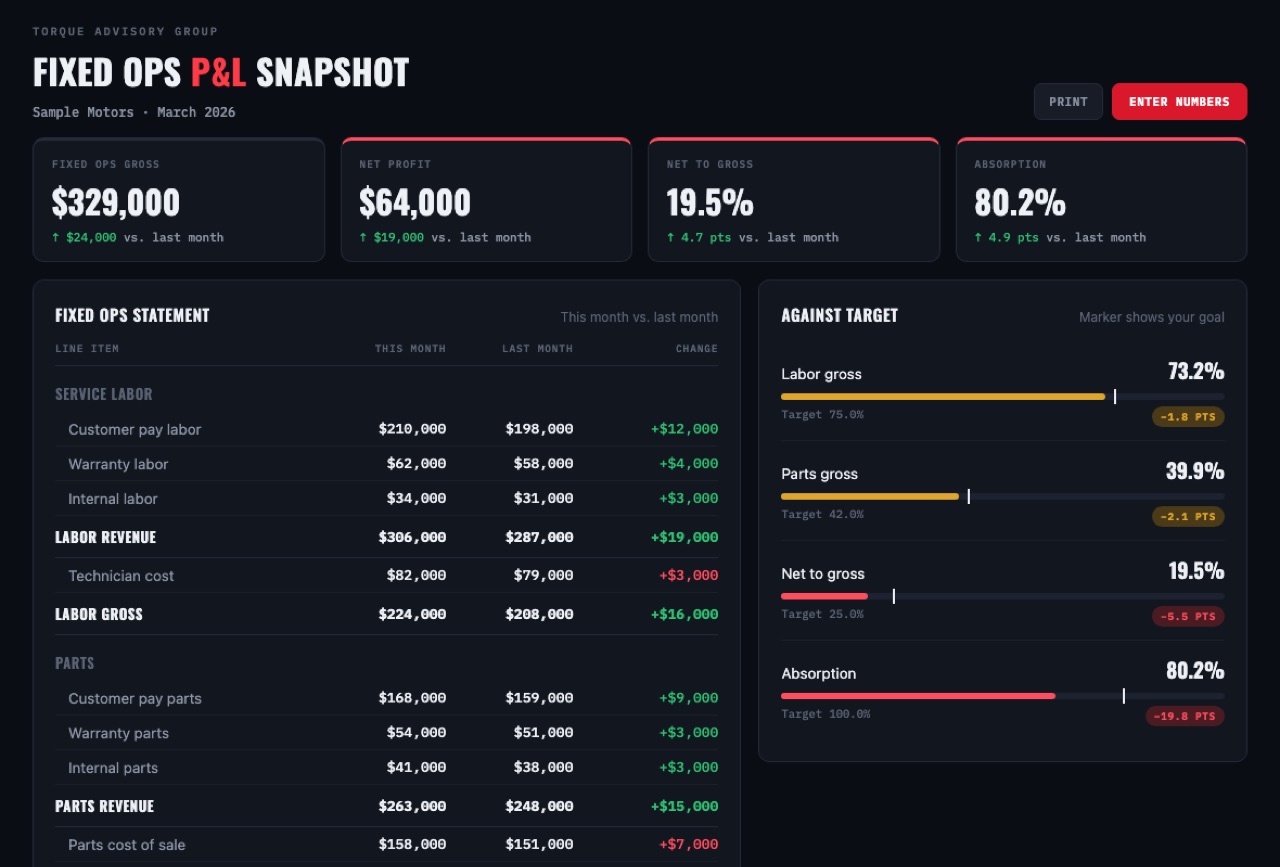
A complete service and parts P&L you run every month — labor gross, parts gross, expenses, net, and the absorption number your dealer principal actually asks about.
The tools show you the number. We work alongside your fixed ops team to actually move it — rate strategy, technician productivity, and pay plans that hold.
ABOUT TORQUE ADVISORY GROUP
Torque Advisory Group works exclusively with dealership service departments — fixed ops managers, service directors, and dealer principals who are tired of static PDF reports and want an actual answer to "who is costing us money and why."
We combine dealership domain knowledge with rigorous data engineering: every technician score, every op code count, every forecast is traceable back to the source repair order. No black boxes.
GET STARTED
Send us a recent export — we'll come back with a no-obligation snapshot of your service department's performance.